Measuring user behavior and knowing where your customers come from is essential for your company's success. In this blog post, you can find out which questions are crucial and which tools can help you answer them.
When does the user become a customer?
Customer experience - CX for short - stands for "customer experience", i.e. the perceptions, feelings and impressions that customers have when interacting with a company or brand. This includes the purchasing process, but of course also customer service, their encounter with the website, social media channels and - of course - the product itself. Positive experiences make customers more likely to trust the brand, appreciate it and perhaps even recommend it to others.
Bad ones, in turn, threaten the company's reputation and sales in large numbers . Measuring the customer experience is therefore essential in order to understand which people you are addressing as a company, how you meet them, fulfill their needs, how and when they become customers and which of them remain interested in your offer in the long term. But can CX be measured "properly"?
How do you measure CX? - Questions, methods, tools
Until the early 2000s, most attempts to determine customer satisfaction were based on surveys, questionnaires and customer feedback cards. This was often inaccurate, slow and costly. Today, we have web analytics tools such as Google Analytics, Matomo and Piwik Pro at our disposal. These programs measure all interactions with websites. Other tools are also valuable for CX data. But precisely because they all collect very large amounts of data in a very short time, it is important to ask them the right "questions" or give them commands. These are questions such as:
Where do the streams of visitors to my website come from?
The answer begins with deriving organic or paid clicks in search engines such as Google and capturing direct page views - including from pages on social networks.
How do users interact with the website?
This involves evaluating click paths, bounce rates from landing pages and click rates of certain website elements such as forms or CTA buttons. In order to calculate the conversion rate, for example, the sending of contact forms (B2B area) or the purchase of a product (e-commerce) is tracked.
Which users become customers?
One of the most important and exciting questions is when and why which users become customers - "convert". Or even bounce. This is known as the "conversion rate". Cookies can be used to identify returning users and determine the frequency of their visits before a conversion.
If companies offer a customer area with login on their website, they can also configure user ID tracking: Here, users are assigned customer numbers that can be used to track their activities directly. The data obtained from this is very valuable for further sales activities, email campaigns, etc.
How do customers behave? What are their interests and needs?
When it comes to more complex questions, "classic" web analytics tools reach their limits - CRM systems such as Salesforce, HubSpot or Pipedrive, on the other hand, are able to collect data from various sources - and not just evaluate online behavior. This gives companies a much more comprehensive picture of their customers.
All-in-one marketing platforms such as HubSpot or Microsoft Dynamics even offer online marketing, web analytics and CRM functions in one place, allowing users to be monitored throughout their entire customer journey.
Which elements on the website interest users, and which don't?
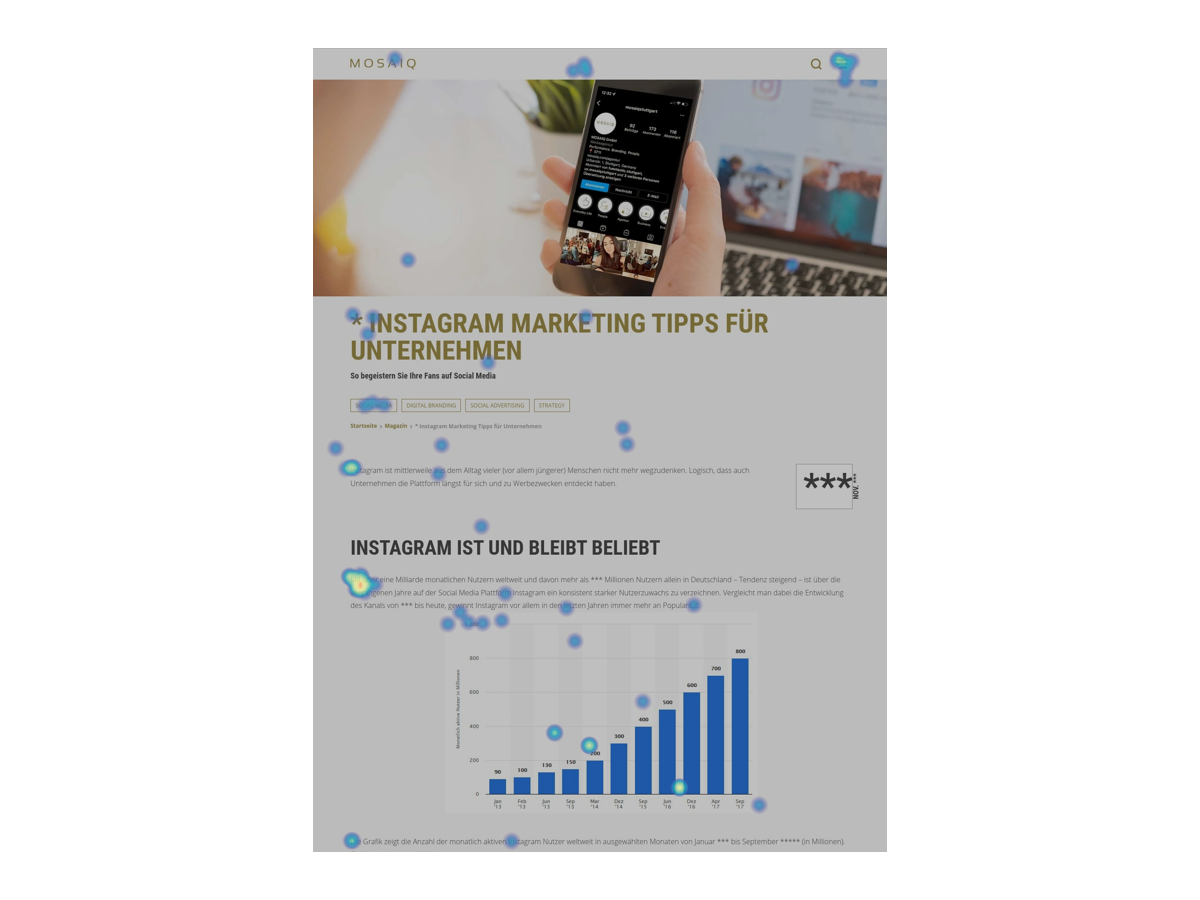
Heatmap analysis tools such as Hotjar measure the movement of the mouse.
Which elements are most likely to lead to conversions?
A/B testing tools such as Google Optimize test which presentation of website elements (e.g. structure of the landing page, a form, a paragraph section) is best received. This allows developers and designers to design websites and online stores in a more targeted way.
How satisfied are users with the website? Would they recommend it to others?
Conventional user surveys on the website and / or the determination of the Net Promoter Score are suitable for this purpose: This key figure represents satisfaction, loyalty and retention in the ratio between positive and negative users. Tools such as Informizely or Paperforms can usually also be linked to traditional web analytics tools. The collected data can be further used and analyzed there.Before using the tool: define the right KPIs
Whoever uses analysis tools to evaluate the success of a customer experience must first define suitable measurement values and key performance indicators (KPIs) - the benefits of the analysis depend on them. Classic marketing KPIs would be, for example:
German terms: customer value, customer revenue value
English term: Customer Lifetime Value (CLV)
Question / definition: How much revenue do individual customers generate for a company within the business relationship?"
German terms: customer churn rate / rate, churn rate / rate
English term: customer churn rate
Question/definition: How many customers are lost in relation to the total number of customers within an observation period
German terms: Customer retention rate
English term: Customer retention rate
Question / definition: What percentage of customers does the company retain over a defined period of time
Of course, independently defined, industry-specific metrics are also useful. For example, user-defined segments and target groups can be created on Google Analytics. This is very useful if you want to evaluate the behavior of very specific user or customer groups and address them again in retargeting campaigns, for example.
Important: Evaluate data in its entirety
A common problem when evaluating user behavior is the presence of data from many different sources (web analytics tools, CRM systems, email programs, online marketing and advertising platforms such as Facebook Ads or LinkedIn Ads, etc.).
To really understand a CX, centralized reporting is therefore important: it helps to identify the channels through which potential customers actually interact and convert.
Data visualization tools such as Google Looker Studio (formerly: Google Data Studio), Power BI from Microsoft or Tableau from Salesforce are also particularly recommended. It is also helpful to use a data warehouse as a central storage location for all CX-relevant data.
Conclusion: Putting CX into facts and figures - no easy task
Understanding CX is a central component of modern marketing and a prerequisite for business success. Only concrete measurements make it possible to improve customer communication, adapt online marketing campaigns, landing pages, page navigation, sales channels and forms or even set sales activities based on customer data.
It is in the nature of things that this is a complex matter. Experiences remain subjective and not always predictable, let alone controllable; there is a multitude of activities and many different information values.
On the other hand, it is all the more helpful to use good tools and work on customer satisfaction across departments. If you are an entrepreneur yourself, try to attract the "right" users to your site(s) - those who have the potential to become customers in the first place. Once you have won them over, you need to keep encouraging them to interact with your company and keep them satisfied.


